Editor’s Synopsis
Result Highlights
Credit Highlights
Ahmedabad, 24 November 2025: The Adani Portfolio—India’s leading infrastructure and utilities portfolio—today announced its H1 FY26 Financial Performance and the Credit and Results Compendium. The documents provide an overview of the portfolio’s financial performance and offer detailed insights into its credit strength and long-term resilience.
The disclosures not only provide the latest financial performance but also provide a comprehensive view of the Group’s financial performance, credit strength, and long-term resilience over a longer timeframe, since 2019.
Commenting on the results, Mr Jugeshinder Singh, Group CFO, Adani Group, said: “Our core infrastructure businesses continue to deliver strong double-digit growth even as we execute one of the largest capex programs, aligned with India’s Viksit Bharat capex super cycle. Adjacency businesses are also showing momentum. In H1 FY26, we recorded our highest-ever capex in the first half despite seasonal factors. Importantly, our debt metrics continue to remain below the guided range even after doubling capex to ₹1.5 lakh crore—reflecting strong financial discipline. What took 25 years to build, we are now gearing up to replicate within a single year, and as new assets become operational on schedule, we expect to sustain returns on asset of 15–16%. Our focus remains on flawless execution and world-class operations. With rising AAA domestic ratings and stable USD ratings, our long-tenor infrastructure assets are increasingly attractive to global institutions.”
Adani Portfolio – H1 FY26 and TTM Sept’25 Financial Performance (EBITDA in INR Cr)
| Sector | H1 FY26 | H1 FY25 | Y-o-Y Growth | TTM Sept’25 | TTM Sept’24 | Y-o-Y Growth |
|---|---|---|---|---|---|---|
| Utility* | 23,239 | 22,503 | 3.3% | 44,113 | 41,518 | 6.3% |
| Transport | 12,125 | 9,938 | 22.0% | 22,658 | 18,846 | 20.2% |
| AEL - Infrastructure Businesses | 5,549 | 5,262 | 5.4% | 10,371 | 8,330 | 24.5% |
| A. Sub-total (Infrastructure) | 40,913 | 37,703 | 8.5% | 77,142 | 68,694 | 12.3% |
| B. Adjacencies (Cement) | 4,305 | 3,120 | 37.9% | 9,829 | 6,991 | 40.6% |
| Sub-total (Infra+Adjacencies) | 45,218 | 40,823 | 10.8% | 86,971 | 75,685 | 14.9% |
| C. AEL- Existing Businesses | 2,157 | 3,416 | (36.9%) | 5,972 | 7,922 | (24.6%) |
| Portfolio EBITDA (A+B+C) | 47,375 | 44,239 | 7.1% | 92,943 | 83,607 | 11.2% |
H1 FY26 & Sep’25 TTM PERFORMANCE HIGHLIGHTS
Record Earnings: EBITDA reached an all-time high of INR 47,375 Cr (USD 5.3 Bn) in H1 FY26, taking TTM EBITDA to INR 92,943 Cr (USD 10.4 Bn) — an 11.2% YoY increase. 83% of H1 FY26 EBITDA came from the Group’s Core Infrastructure platform, which includes:
These segments continue to provide stable, long-term cash flows.
Strong and Stable Cash Generation: Cash After Tax / FFO stood at INR 65,016 Cr (USD 7.2 Bn), reflecting healthy operating cash flow across businesses.
Prudent Leverage: Net Debt-to-EBITDA at 3x, comfortably below the guided 3.5x–4.5x range across portfolio companies, highlighting disciplined capital management. The number has slightly increased from six months ago, as the portfolio companies have now accelerated their capex programs.
Accelerated Capex Cycle: Robust cash flows and continued access to capital, enabled by low leverage, resulted in a record asset addition of INR 67,870 Cr (USD 7.6 Bn) in H1 FY26, bringing the total asset base to INR 6.77 lakh Cr (USD 76 Bn). The Group remains on track to deliver its INR 1.5 lakh Cr FY26 capex plan — equivalent to the Adani portfolio’s total asset base until FY19.
Adani Enterprises Ltd., the flagship incubator of the Adani Portfolio, recorded the largest increase in gross assets of INR 17,595 Cr (USD 2 Bn). Adani Green Energy Ltd. and Adani Power Ltd. added assets worth INR 12,314 Cr (USD 1.4 Bn) and INR 11,761 crore (USD 1.3 Bn), respectively.
High Returns on Assets: H1 FY26 ROA stood at 15.1%, despite substantial capital work in progress for new assets. This is one of the highest ROAs globally in the infrastructure sector. Over the past six years, the portfolio has consistently maintained above 15% ROA despite over 3.5x growth in Gross Assets.
Strengthening Credit Quality: 52% of portfolio EBITDA now comes from AAA-rated domestic assets, and 90% from AA- and above. For comparison, in April 2019, only INR 12,186 Cr was generated from AAA assets and AA- assets. The number has now increased to INR 91,879 crore — more than 7.5x. AAA assets alone generated 52% or INR 53,086 Cr of the run-rate EBITDA (including annualized EBITDA of the assets operationalized in mid-year).
This reflects the robustness of the underlying businesses, a consistent focus on financial discipline and the highest level of governance.
Company-wise Financial Performance (EBITDA in INR Cr)
| Entity | H1 FY26 | H1 FY25 | Y-o-Y Growth | Sept’25 TTM | Sept’24 TTM | Y-o-Y Growth |
|---|---|---|---|---|---|---|
| Incubator | ||||||
| Adani Enterprises1 | 7,706 | 8,678 | (11.2%) | 16,343 | 16,252 | 0.6% |
| Utility | ||||||
| Adani Green Energy | 6,324 | 5,584 | 13.2% | 11,272 | 9,966 | 13.1% |
| Adani Energy Solutions | 4,144 | 3,654 | 13.4% | 8,237 | 7,156 | 15.1% |
| Adani Power2 | 12,159 | 12,639 | (3.8%) | 23,438 | 23,157 | 1.2% |
| Adani Total Gas | 612 | 626 | (2.1%) | 1,166 | 1,239 | (5.9%) |
| Transport | ||||||
| Adani Ports & SEZ | 12,125 | 9,938 | 22.0% | 22,658 | 18,846 | 20.2% |
| Adjacencies | ||||||
| Adani Cement | 4,305 | 3,120 | 37.9% | 9,829 | 6,991 | 40.6% |
| Adani Portfolio | 47,375 | 44,239 | 7.1% | 92,943 | 83,607 | 11.2% |
H1 FY26 Company-wise Key Highlights:
Adani Enterprises Ltd
Adani Green Energy Ltd
Adani Energy Solutions Ltd
Adani Power Ltd
Adani Ports & SEZ Ltd
Ambuja Cements Ltd
Links to Result and Credit Compendium Presentations:

The greenfield Navi Mumbai International Airport (NMIA), inaugurated by Hon Prime Minister Shri Narendra Modi on 8 Oct 2025, is expected to cater 90 million passengers annually once fully operationalized.

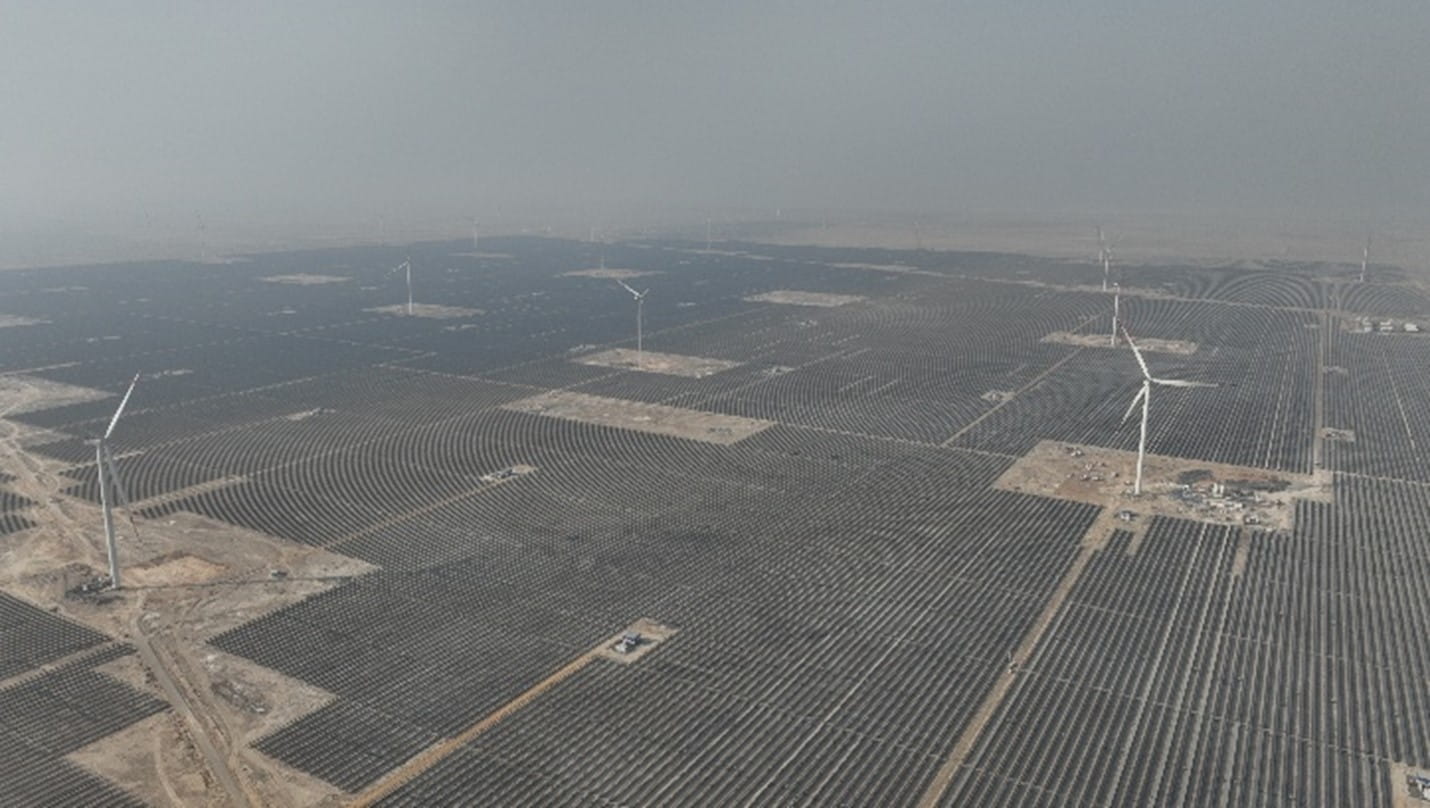
Khavda Renewable Energy Plant


We Care About Your Privacy
We use cookies to give you the best experience on our website. By continuing, you're agreeing to our use of cookies. For more information read our Privacy Policy or edit your preferences
Essential for site operation. < Enables core functions like security and accessibility.
Remembers your settings like language & region.
Anonymous data to improve performance.
Enhanced features like videos & chat.
Improves outreach & measures engagement.
